

Key messages
Annual mean temperature is rising and warming will become more pronounced by the end of the century.
Two scenarios assessed: SSP2-4.5 (business as usual) and SSP5-8.5 (fossil-fuelled).
Figures are ensemble means from climate models, approximate, not exact.
Historical climate
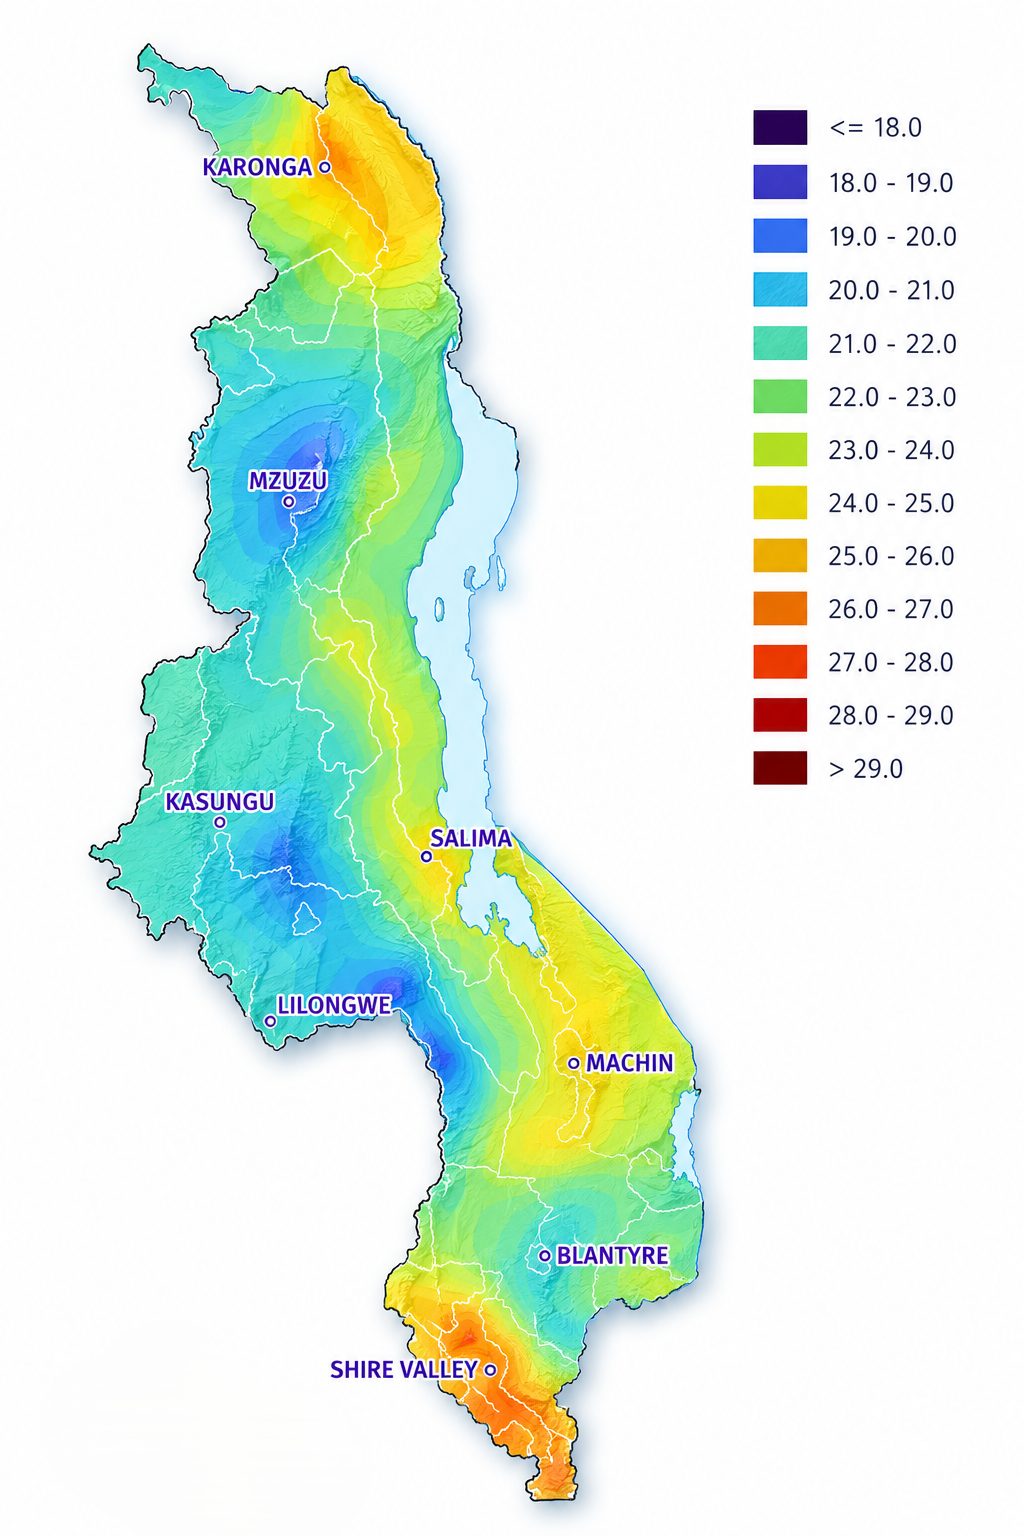
Average annual temperature (1991–2020)
Figure 1. Average annual temperature recorded during the historical baseline years (1991–2020).
23°C
Current average annual temperature
Recorded over the 1981–2010 baseline period. The map (Figure 1) shows how average annual temperature is distributed across the country.
Future projections
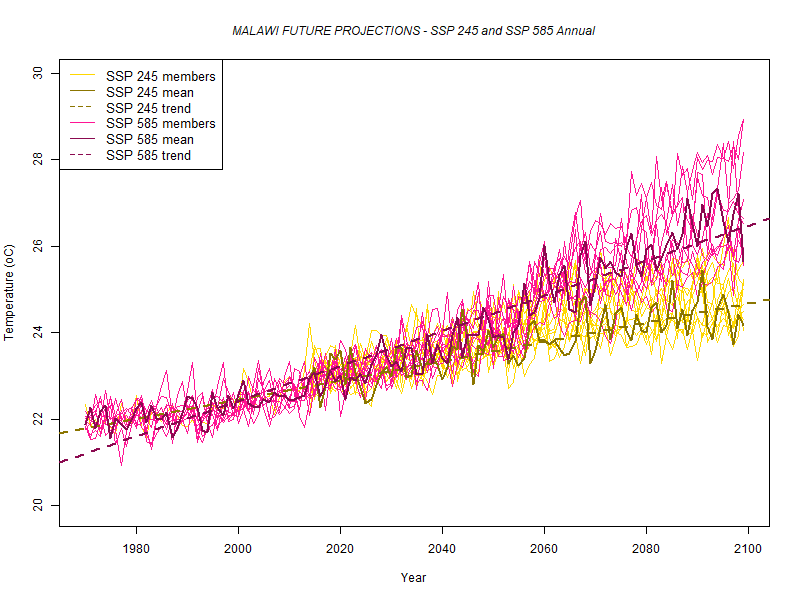
Projected annual temperature to 2080
The table summarises future annual temperatures across the country by the 2080s, based on two Shared Socioeconomic Pathways (SSPs).
Figure 2. Average annual temperature projections for SSP2-4.5 (yellow) and SSP5-8.5 (pink). Dashed lines are the linear trends of the ensemble means.
| Scenario | 2040 | 2060 | 2080 |
|---|---|---|---|
| Current (1981–2010) | 23°C | ||
| SSP2-4.5 · business as usual | 23 | 24 | 24 |
| SSP5-8.5 · fossil-fuelled | 23 | 24 | 25 |
Values in °C. This table represents ensemble means from climate model projections. Actual values vary across models, and results should be interpreted as approximate rather than exact.