Climate Trend › Heatwave days

Heatwave days

Number of days where 35°C is exceeded for 3 consecutive days, across Malawi’s districts, from the 1981–2010 baseline to future climate scenarios.

5 districts · Baseline 1981–2010 · SSP2-4.5 & SSP5-8.5
Explore by district

Heatwave days by district

Select a district to see its historical baseline and projected values under two climate scenarios.
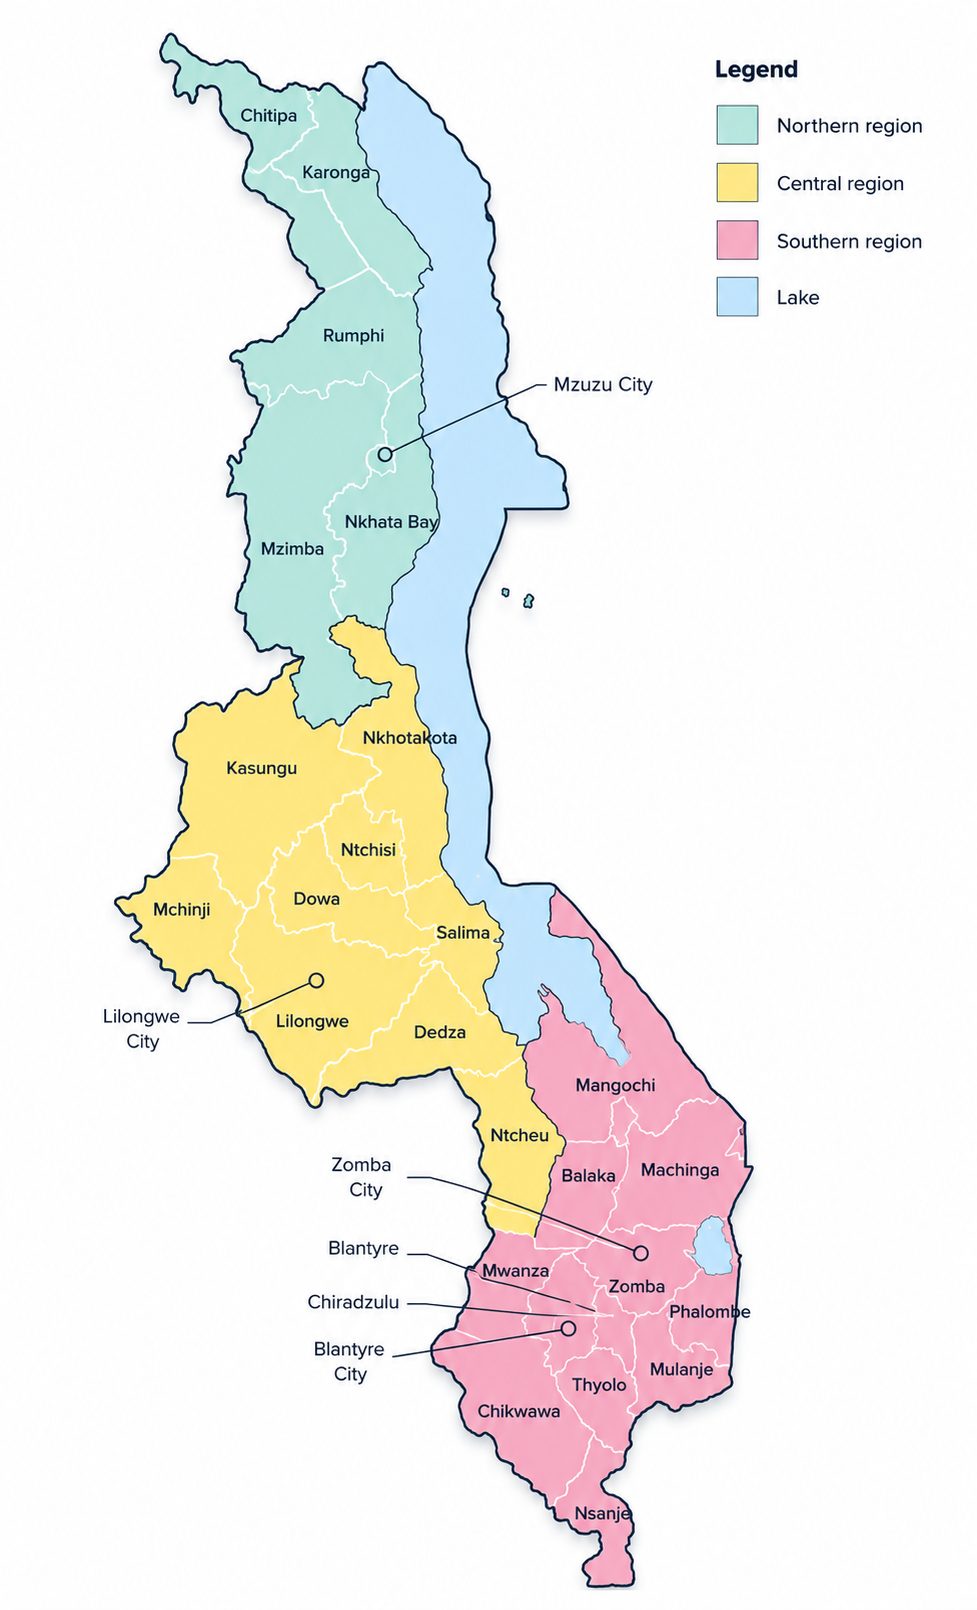
Malawi regions and districts reference map
106 days
Historical baseline (1981–2010)
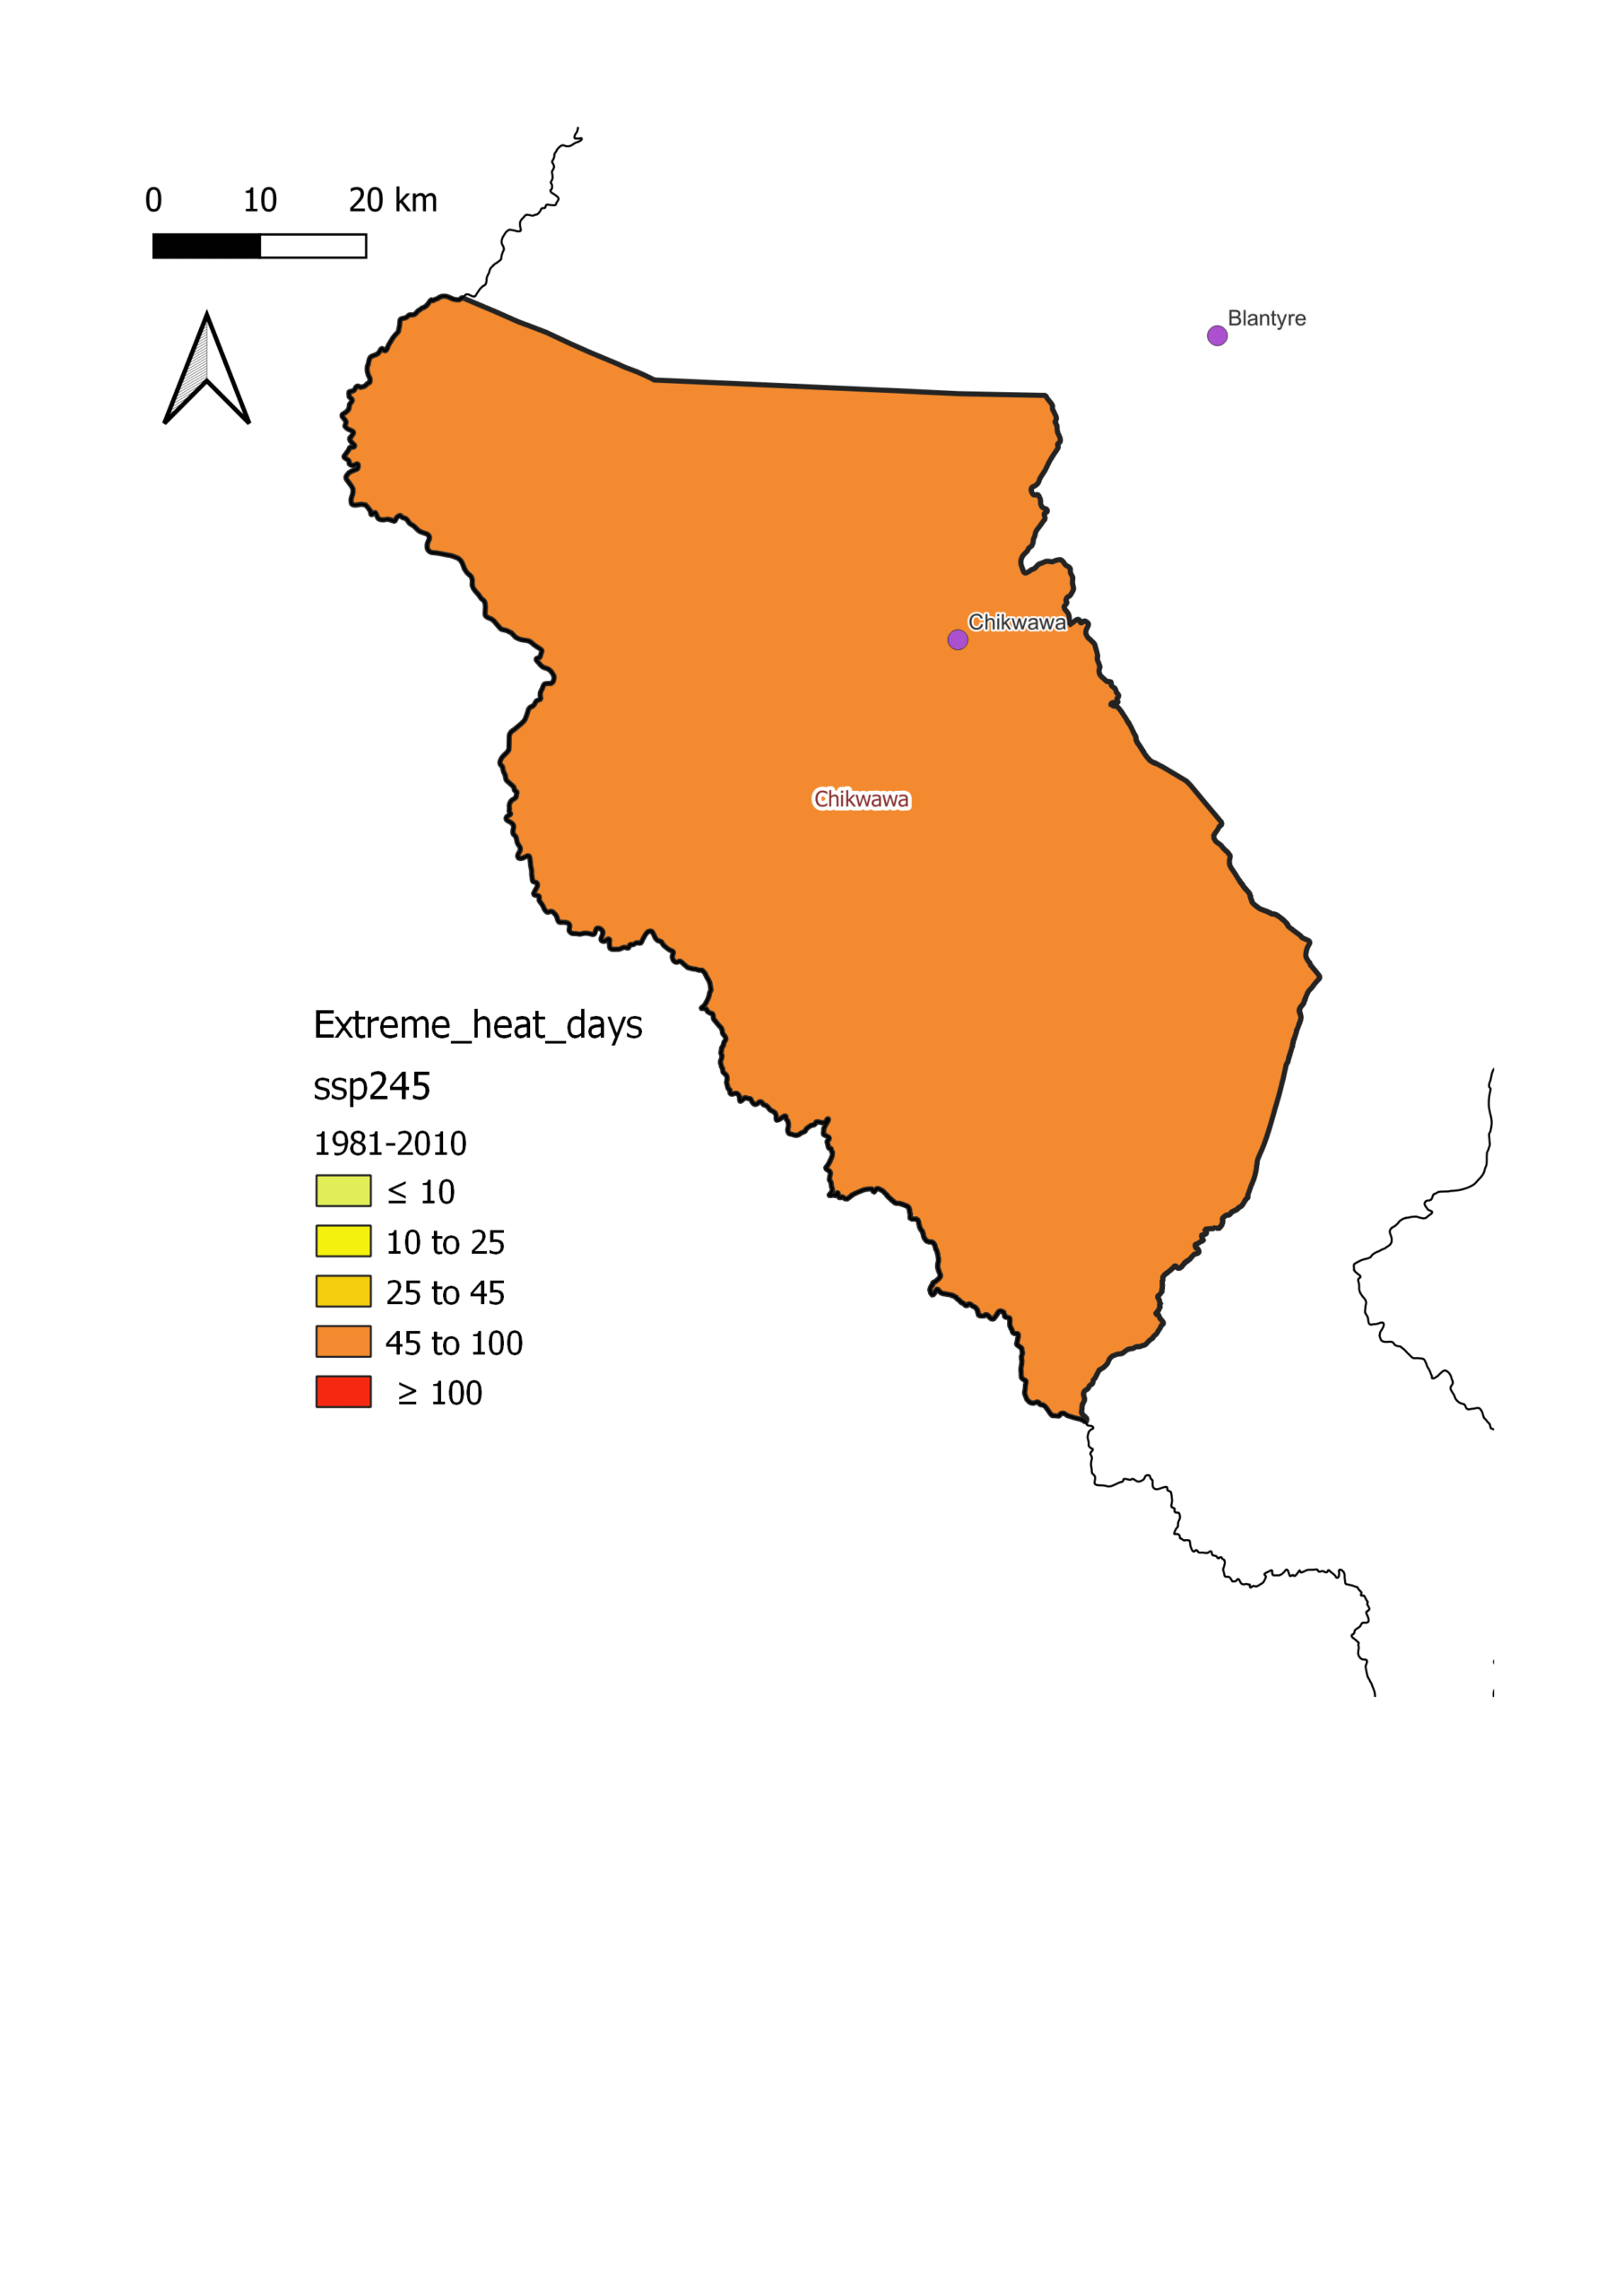
Average number of heatwave days recorded in Chikwawa district over the 1981–2010 reference period.
Scenario204020602080
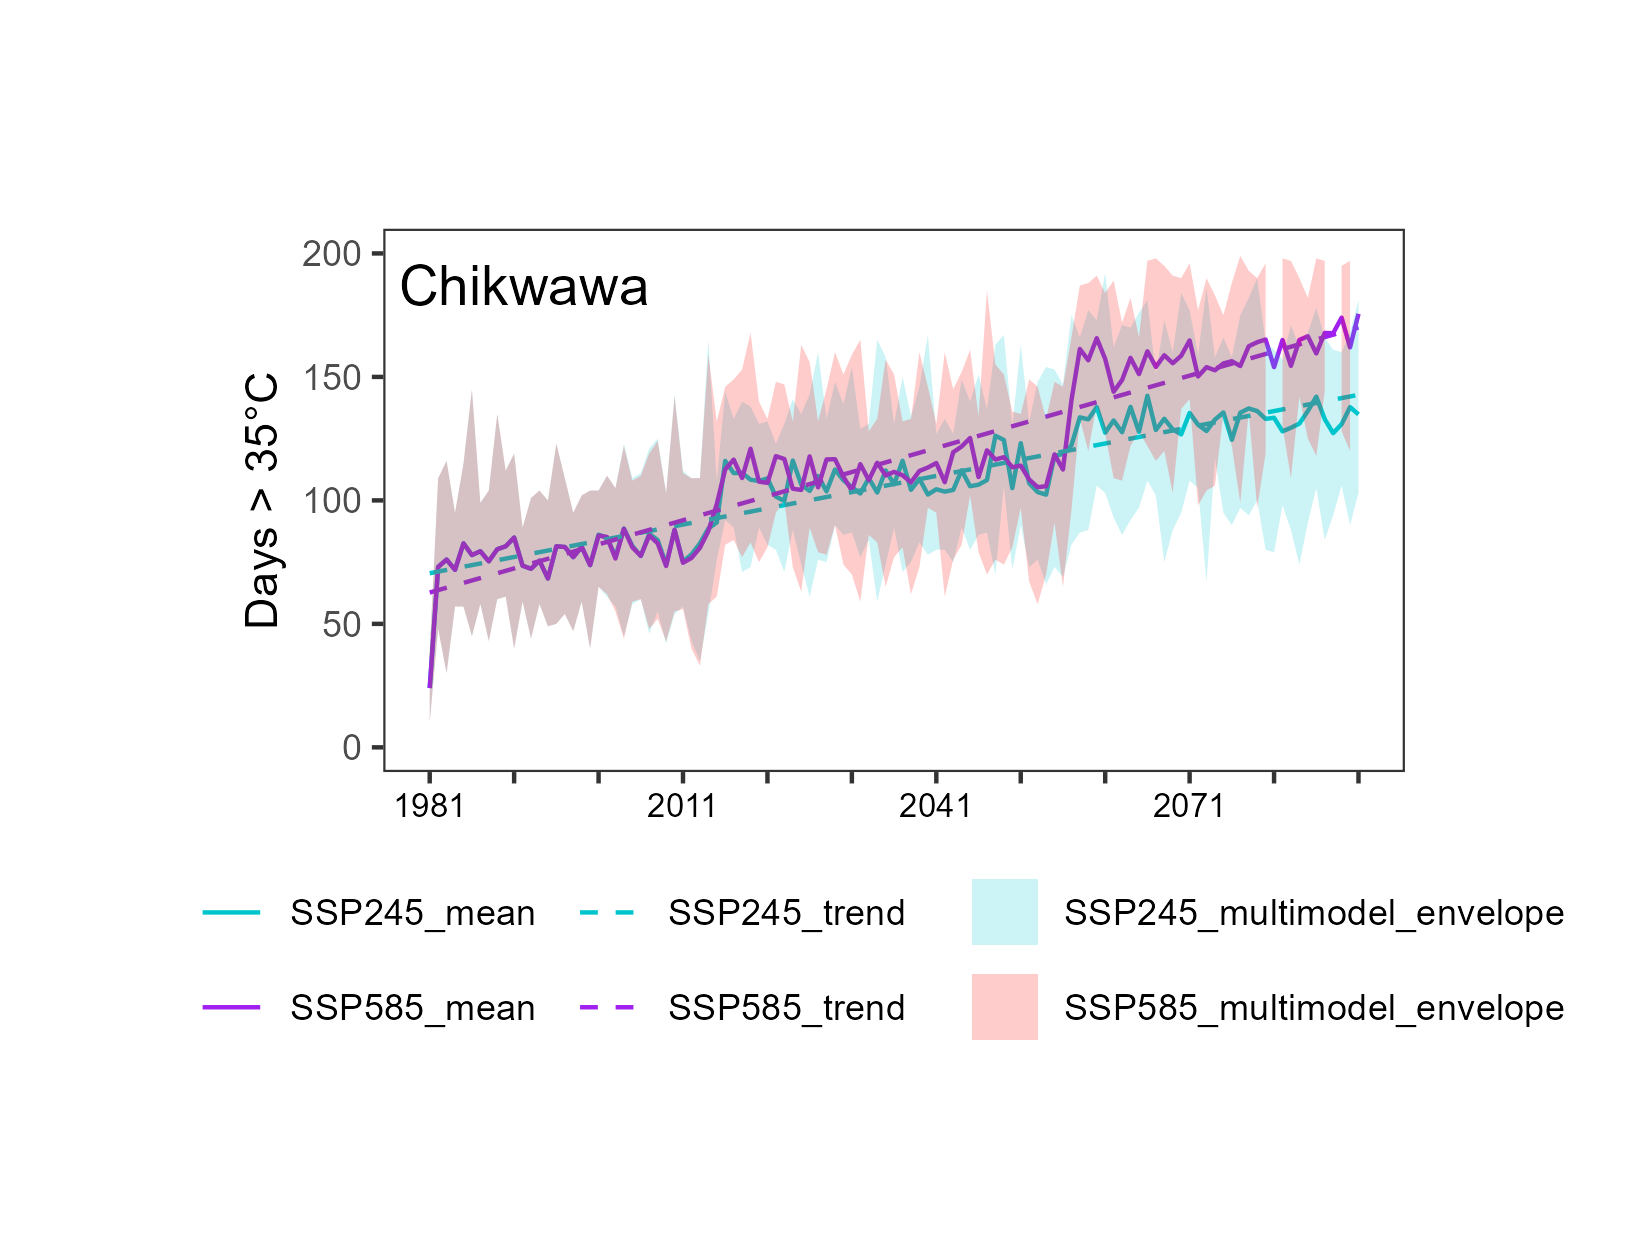
Baseline (1981–2010)106 days
Business as usual (SSP2-4.5)102 d138 d133 d
Tech- & fossil-fuelled boom (SSP5-8.5)113 d166 d165 d
Heatwave days map, Chikwawa, baseline 1981–2010
Figure 1. Heatwave duration: Number of days where 35°C is exceeded for 3 consecutive days recorded during the historical baseline years (1981-2010).
Heatwave days projections chart, Chikwawa
Figure 2. Heatwave duration: Number of days where 35°C is exceeded for 3 consecutive days for both SSP2-4.5(green) and SSP5-8.5(purple). The dashed lines are the linear trends of the ensemble means for SSP members.
11 days
Historical baseline (1981–2010)
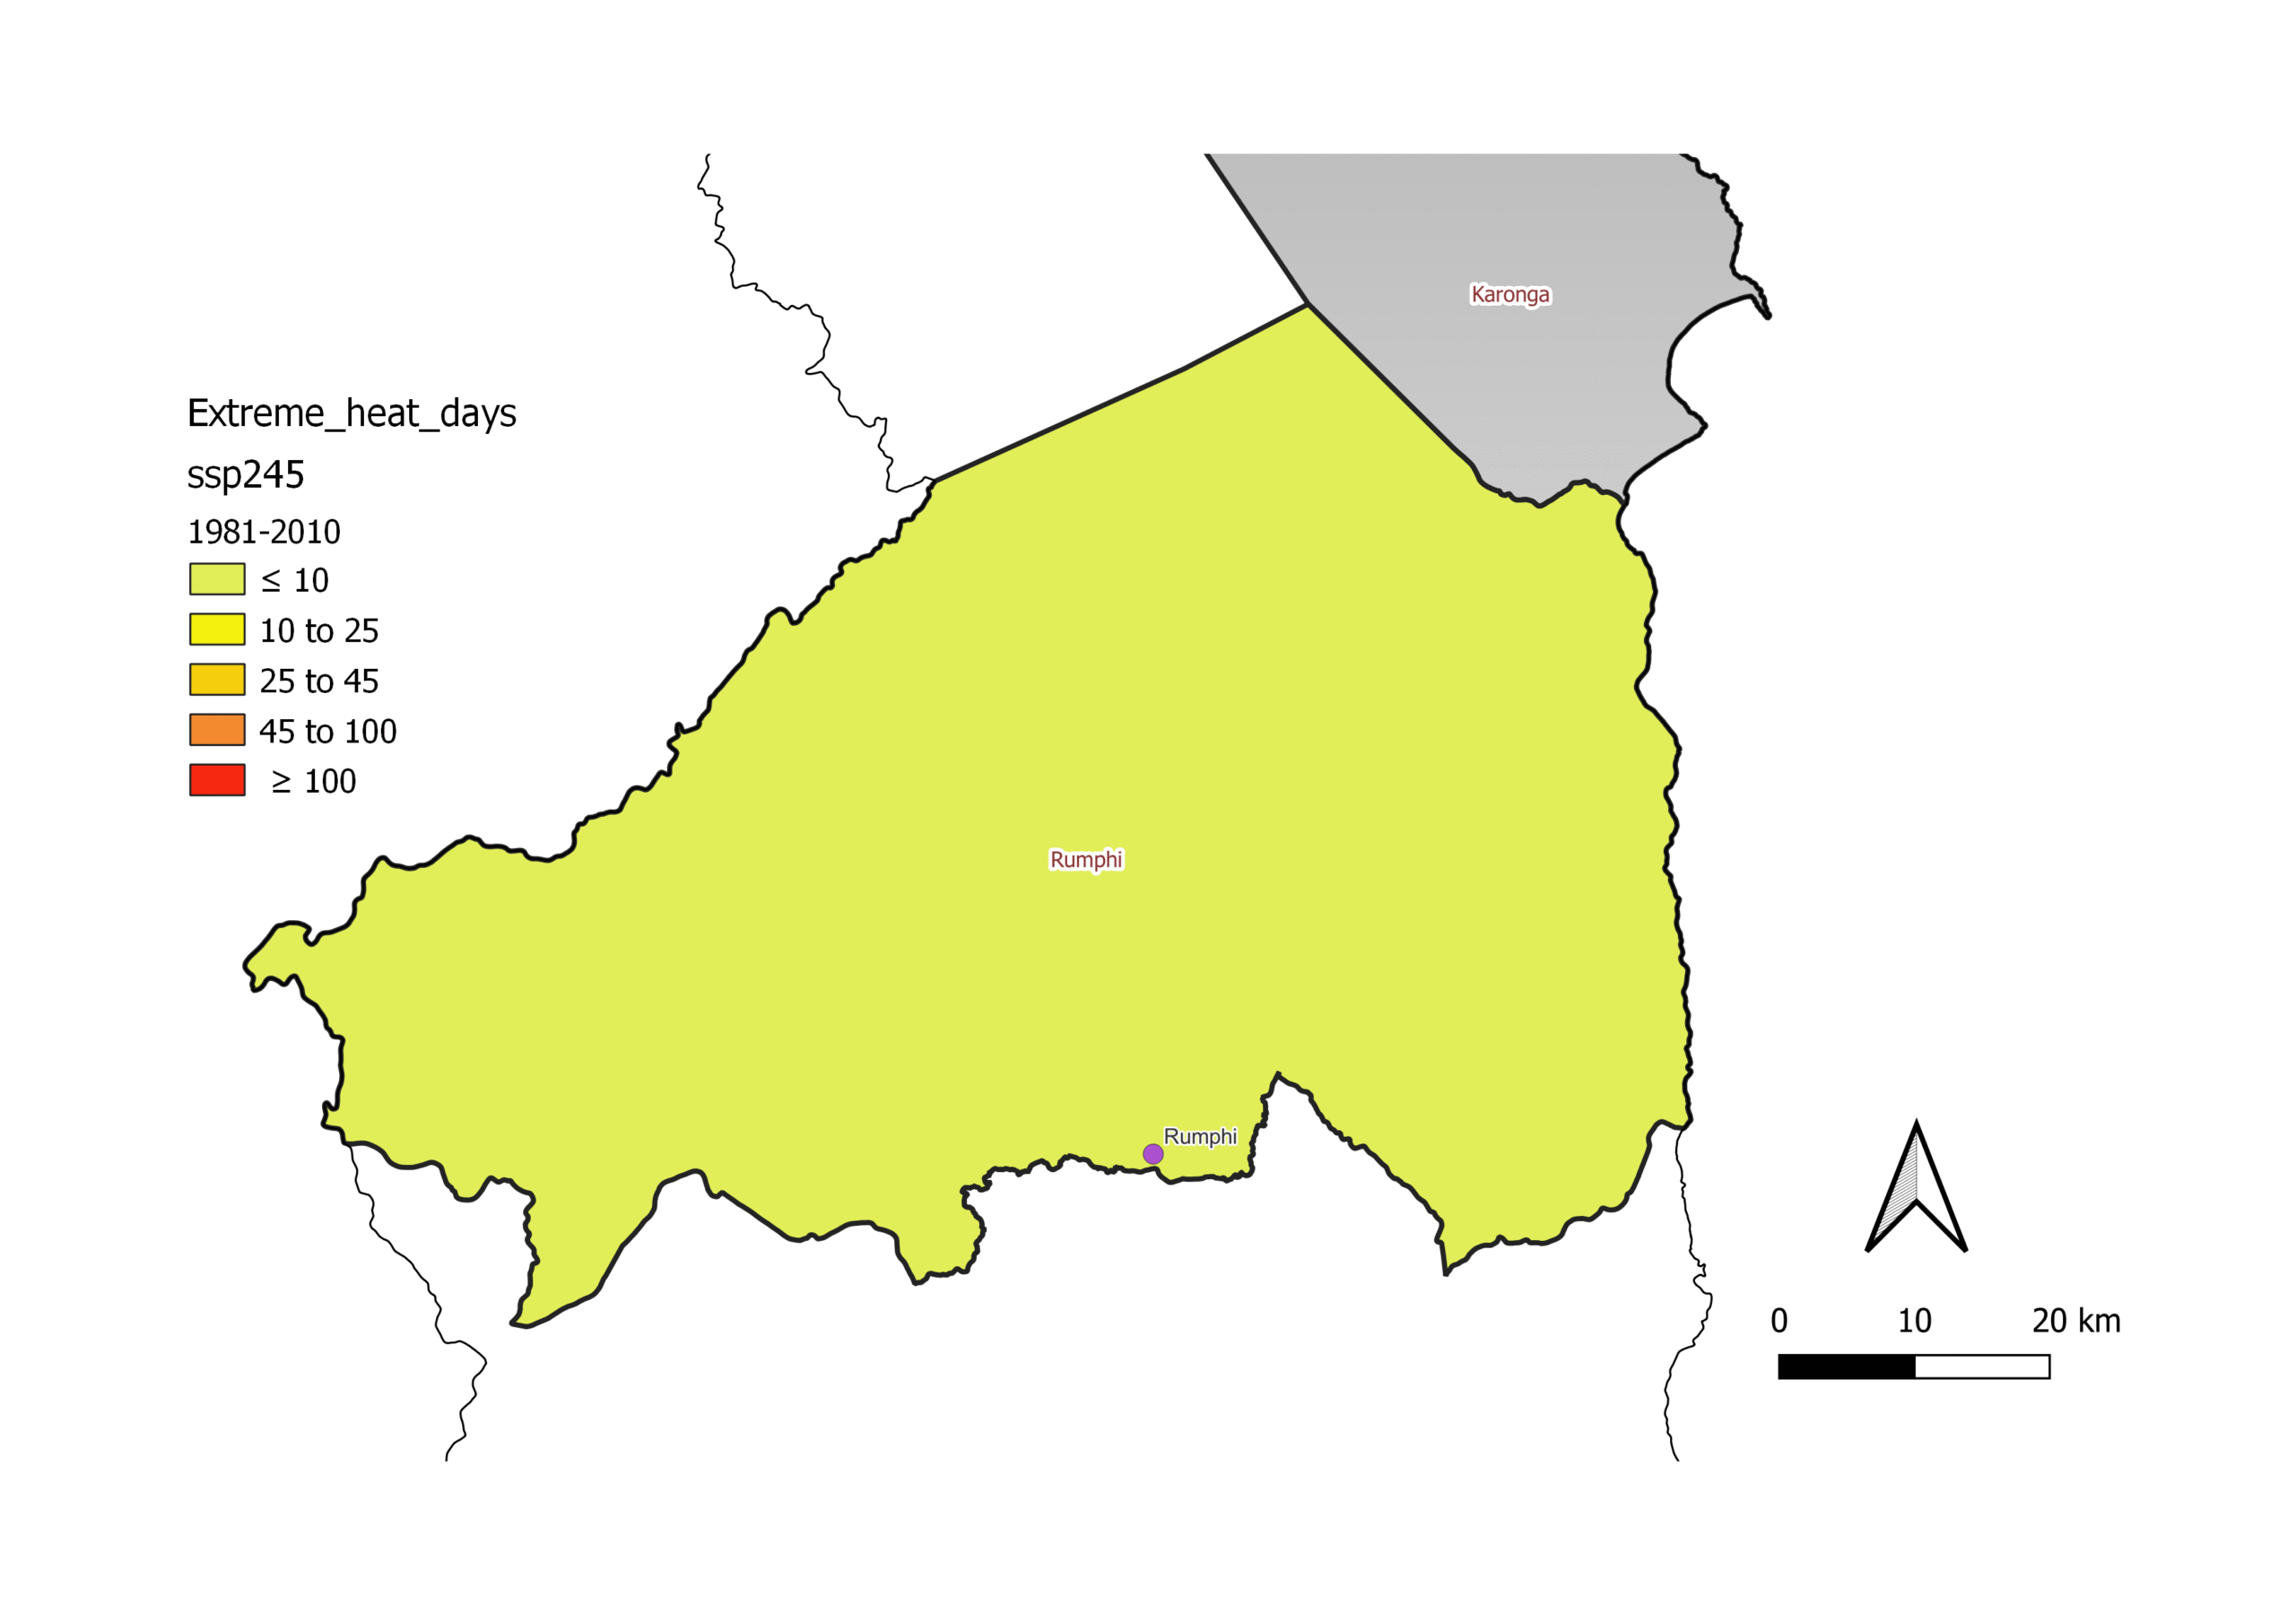
Average number of heatwave days recorded in Rumphi district over the 1981–2010 reference period.
Scenario204020602080
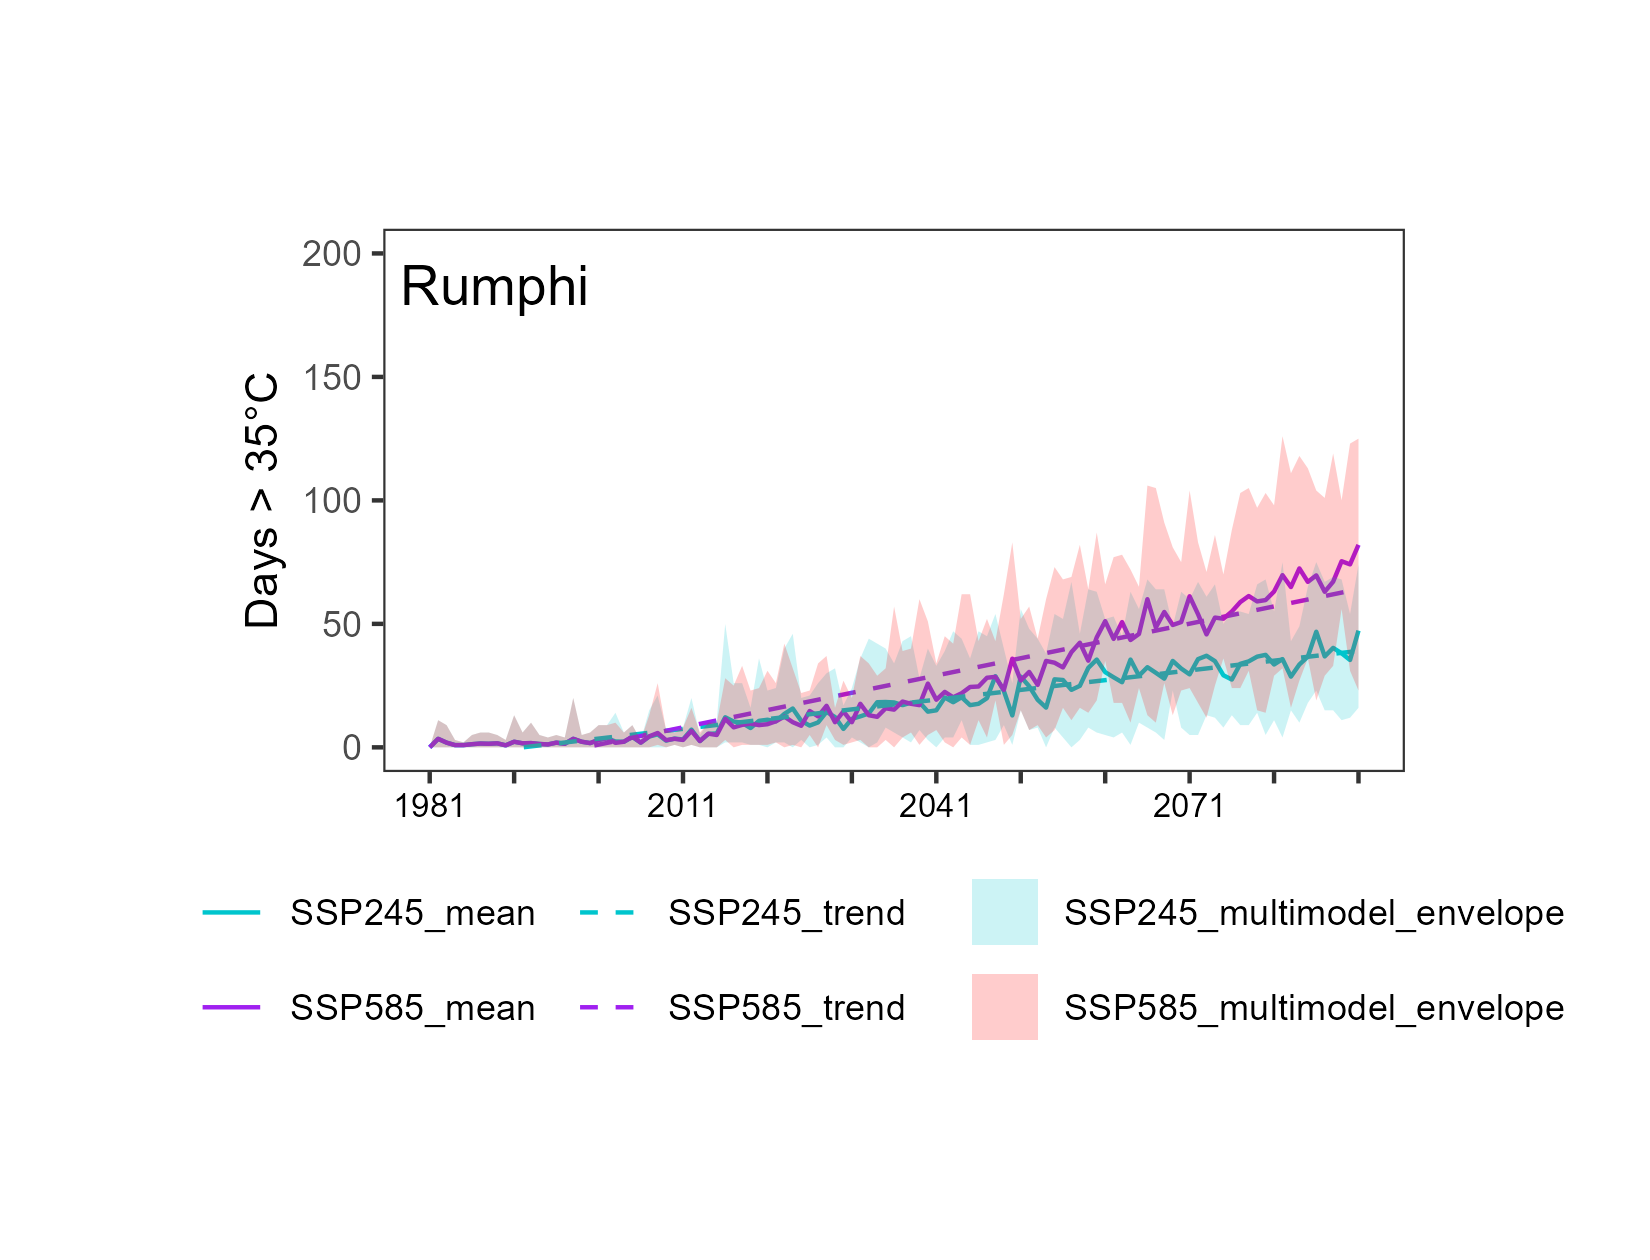
Baseline (1981–2010)11 days
Business as usual (SSP2-4.5)14 d36 d37 d
Tech- & fossil-fuelled boom (SSP5-8.5)26 d45 d60 d
Heatwave days map, Rumphi, baseline 1981–2010
Figure 1. Heatwave duration: Number of days where 35°C is exceeded for 3 consecutive days recorded during the historical baseline years (1981-2010).
Heatwave days projections chart, Rumphi
Figure 2. Heatwave duration: Number of days where 35°C is exceeded for 3 consecutive days for both SSP2-4.5(green) and SSP5-8.5(purple). The dashed lines are the linear trends of the ensemble means for SSP members.
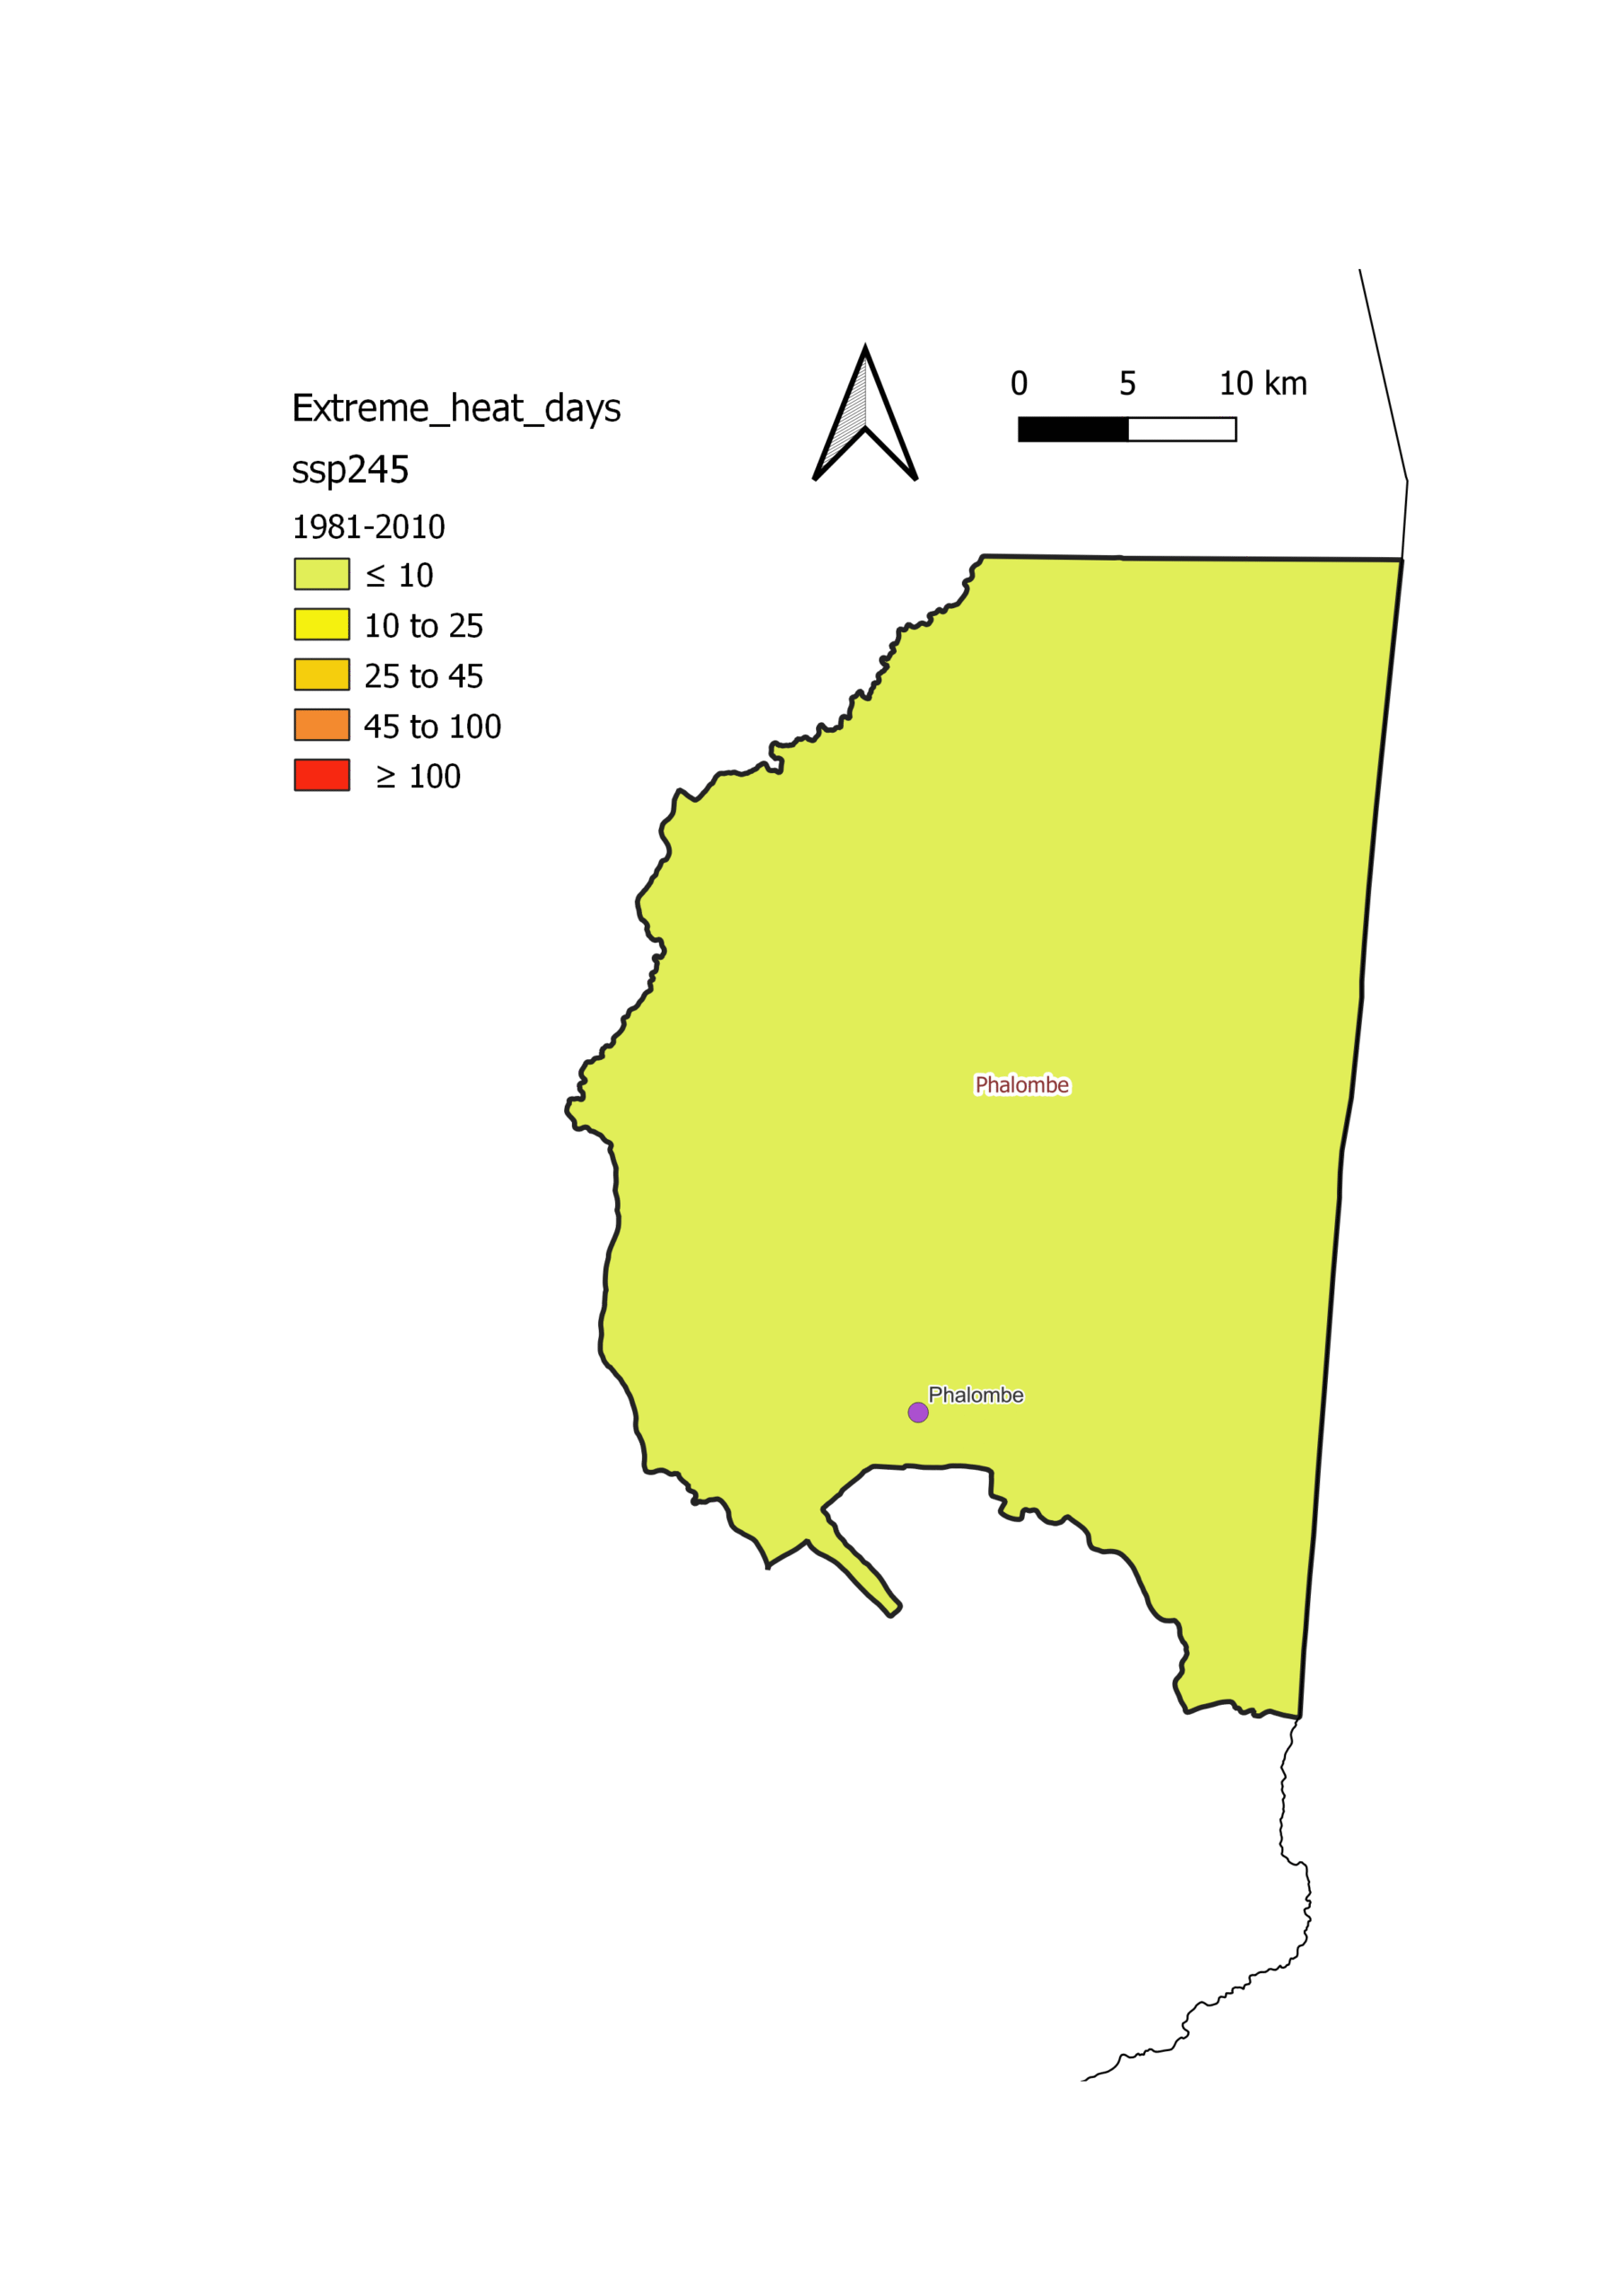
3 days
Historical baseline (1981–2010)
Average number of heatwave days recorded in Phalombe district over the 1981–2010 reference period.
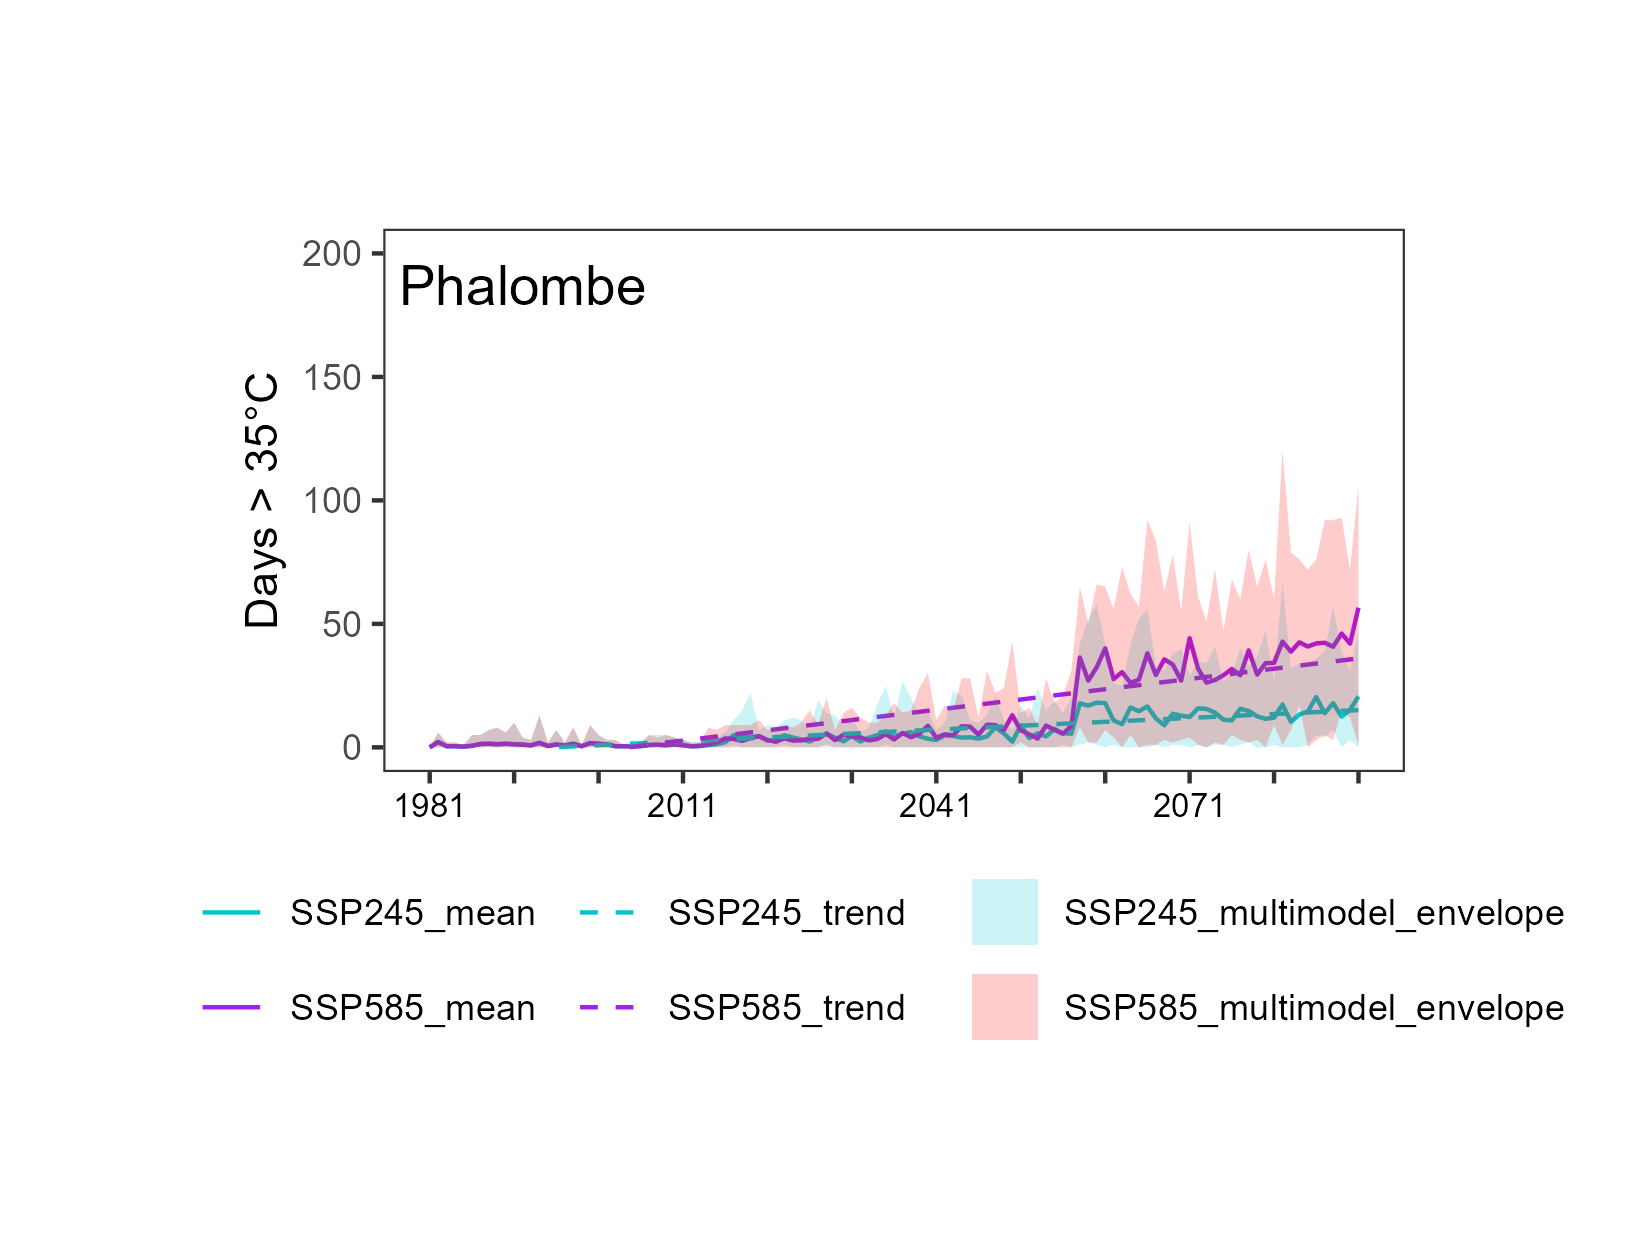
Scenario204020602080
Baseline (1981–2010)3 days
Business as usual (SSP2-4.5)3 d18 d12 d
Tech- & fossil-fuelled boom (SSP5-8.5)9 d32 d34 d
Heatwave days map, Phalombe, baseline 1981–2010
Figure 1. Heatwave duration: Number of days where 35°C is exceeded for 3 consecutive days recorded during the historical baseline years (1981-2010).
Heatwave days projections chart, Phalombe
Figure 2. Heatwave duration: Number of days where 35°C is exceeded for 3 consecutive days for both SSP2-4.5(green) and SSP5-8.5(purple). The dashed lines are the linear trends of the ensemble means for SSP members.
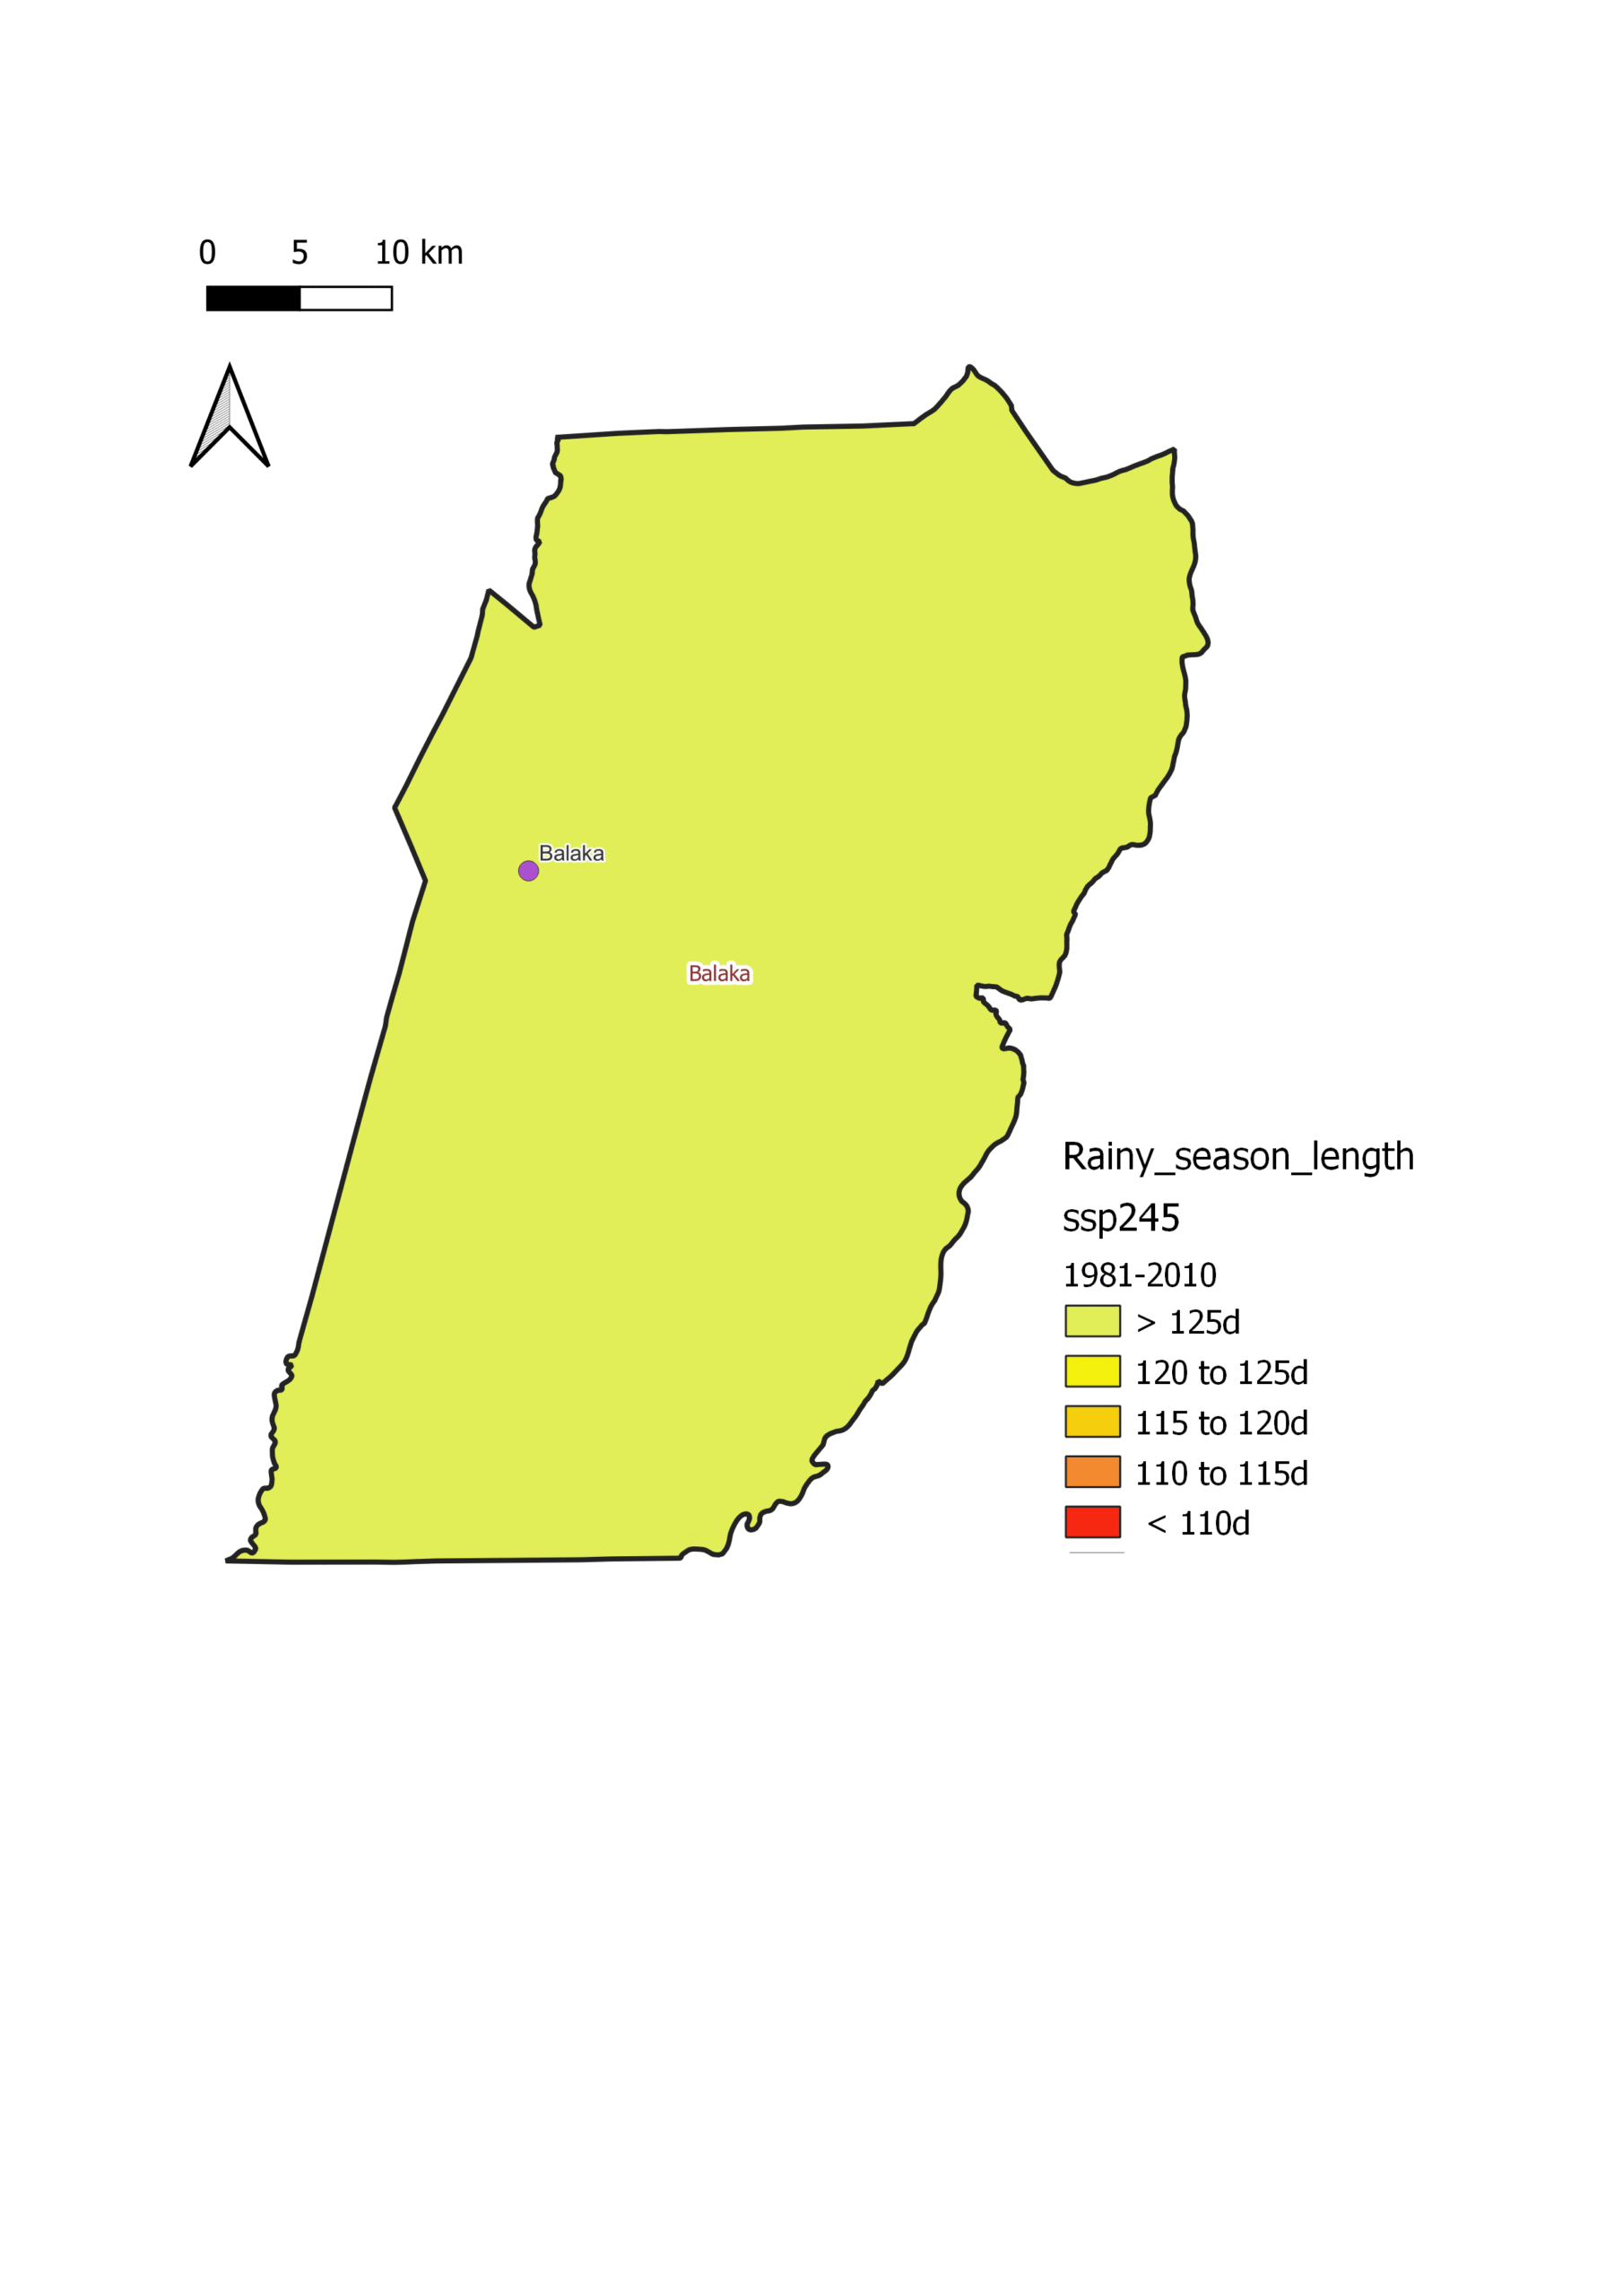
125 days
Historical baseline (1981–2010)
Average number of heatwave days recorded in Balaka district over the 1981–2010 reference period.
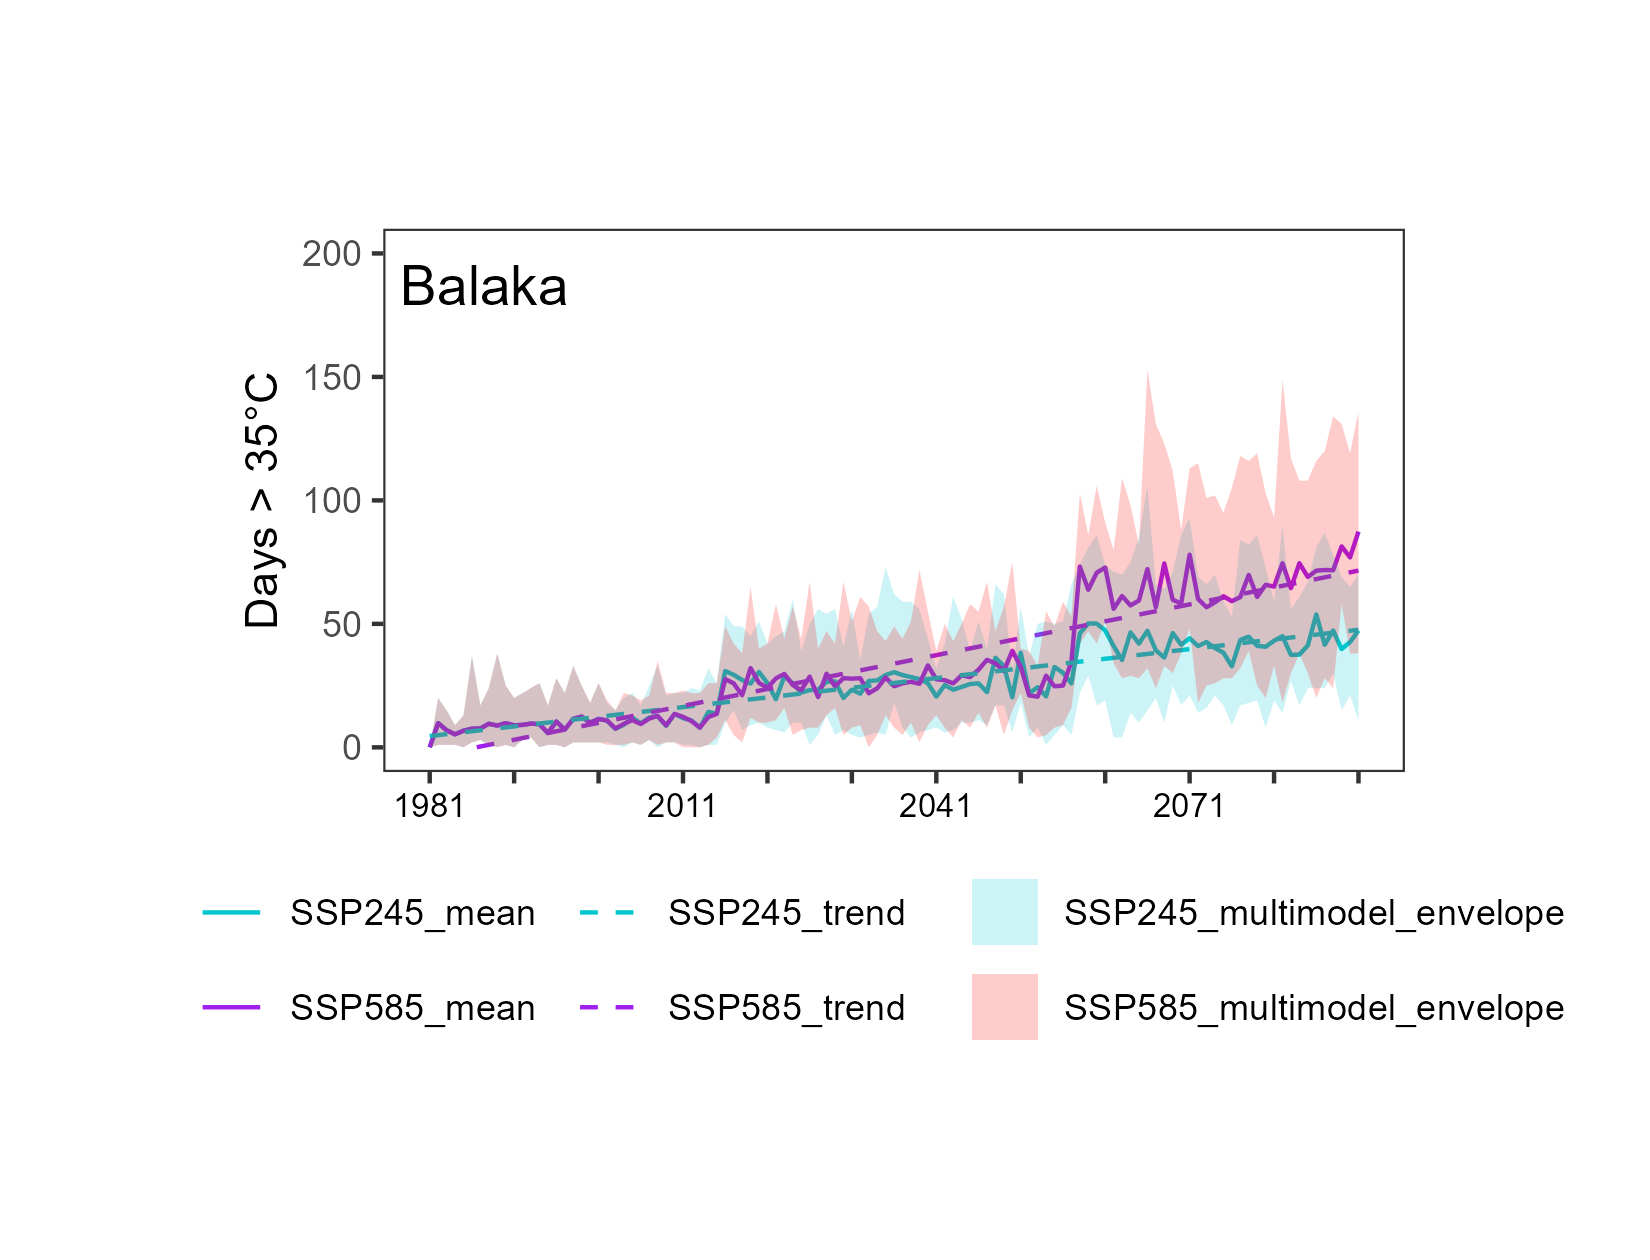
Scenario204020602080
Baseline (1981–2010)125 days
Business as usual (SSP2-4.5)129 d106 d112 d
Tech- & fossil-fuelled boom (SSP5-8.5)127 d113 d118 d
Heatwave days map, Balaka, baseline 1981–2010
Figure 1. Heatwave duration: Number of days where 35°C is exceeded for 3 consecutive days recorded during the historical baseline years (1981-2010).
Heatwave days projections chart, Balaka
Figure 2. Heatwave duration: Number of days where 35°C is exceeded for 3 consecutive days for both SSP2-4.5(green) and SSP5-8.5(purple). The dashed lines are the linear trends of the ensemble means for SSP members.
38 days
Historical baseline (1981–2010)
Average number of heatwave days recorded in Salima district over the 1981–2010 reference period.
Scenario204020602080
Baseline (1981–2010)38 days
Business as usual (SSP2-4.5)109 d113 d107 d
Tech- & fossil-fuelled boom (SSP5-8.5)107 d100 d96 d
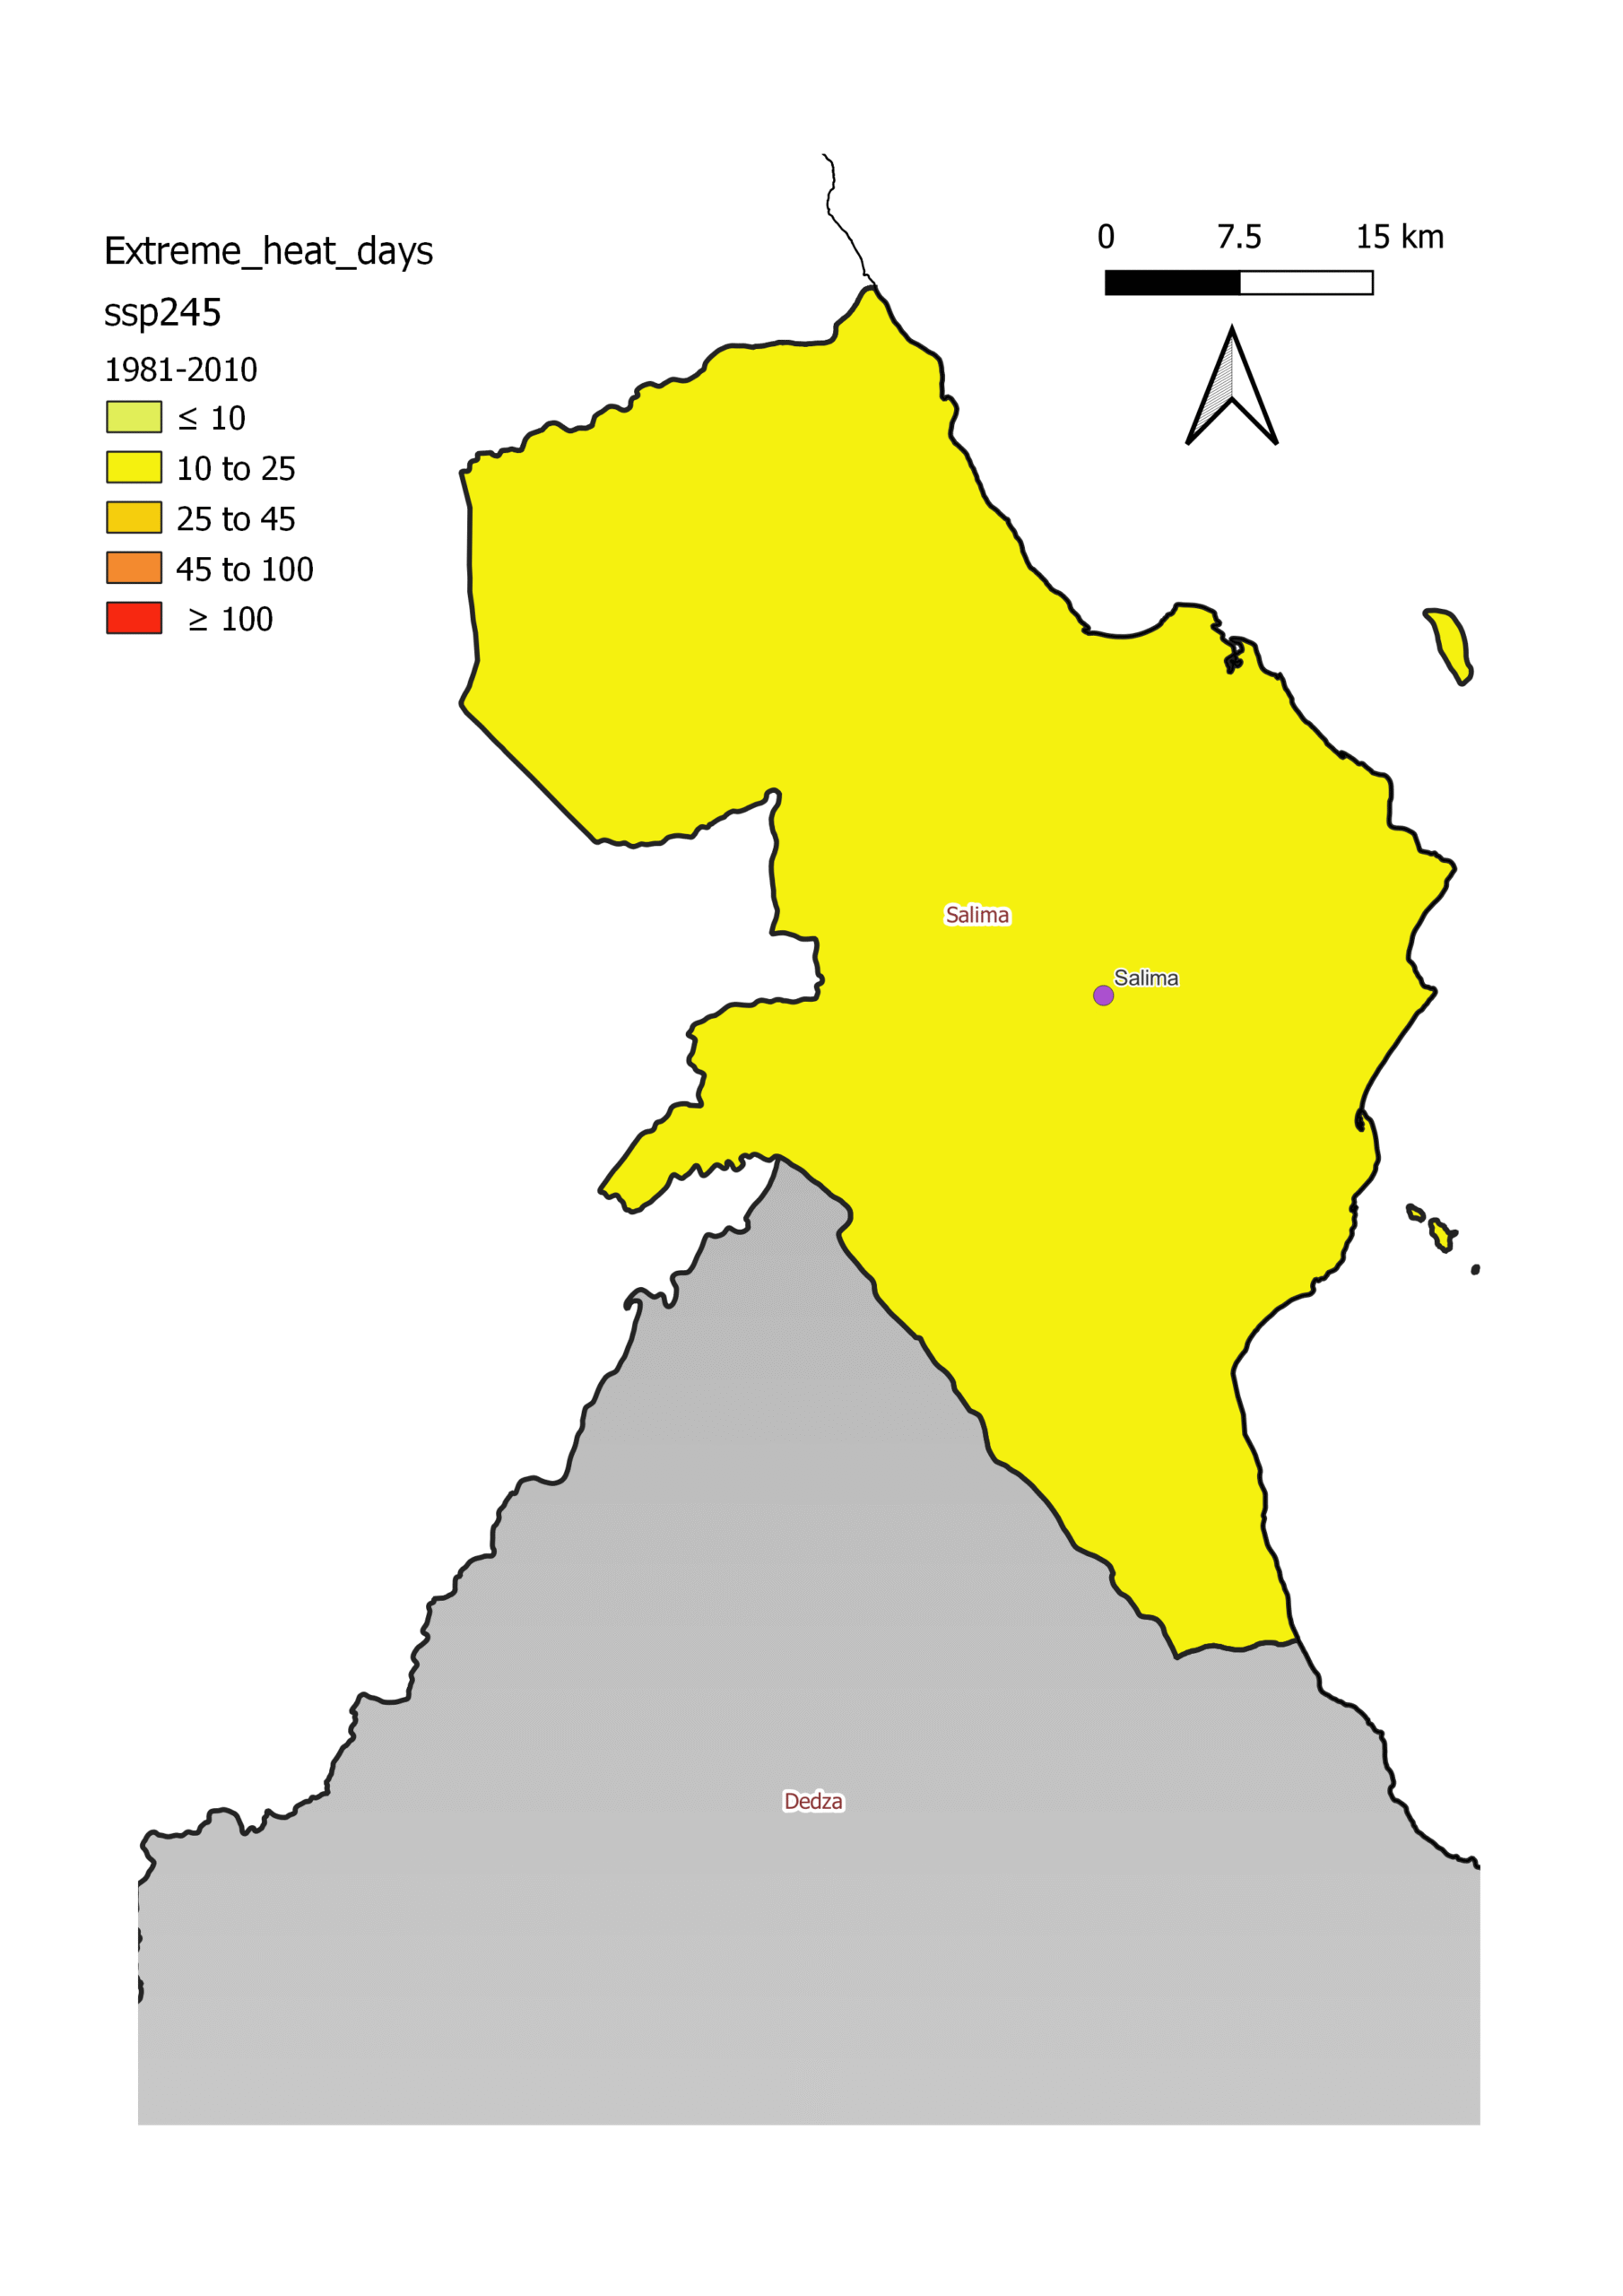
Heatwave days map, Salima, baseline 1981–2010
Figure 1. Heatwave duration: Number of days where 35°C is exceeded for 3 consecutive days recorded during the historical baseline years (1981-2010).
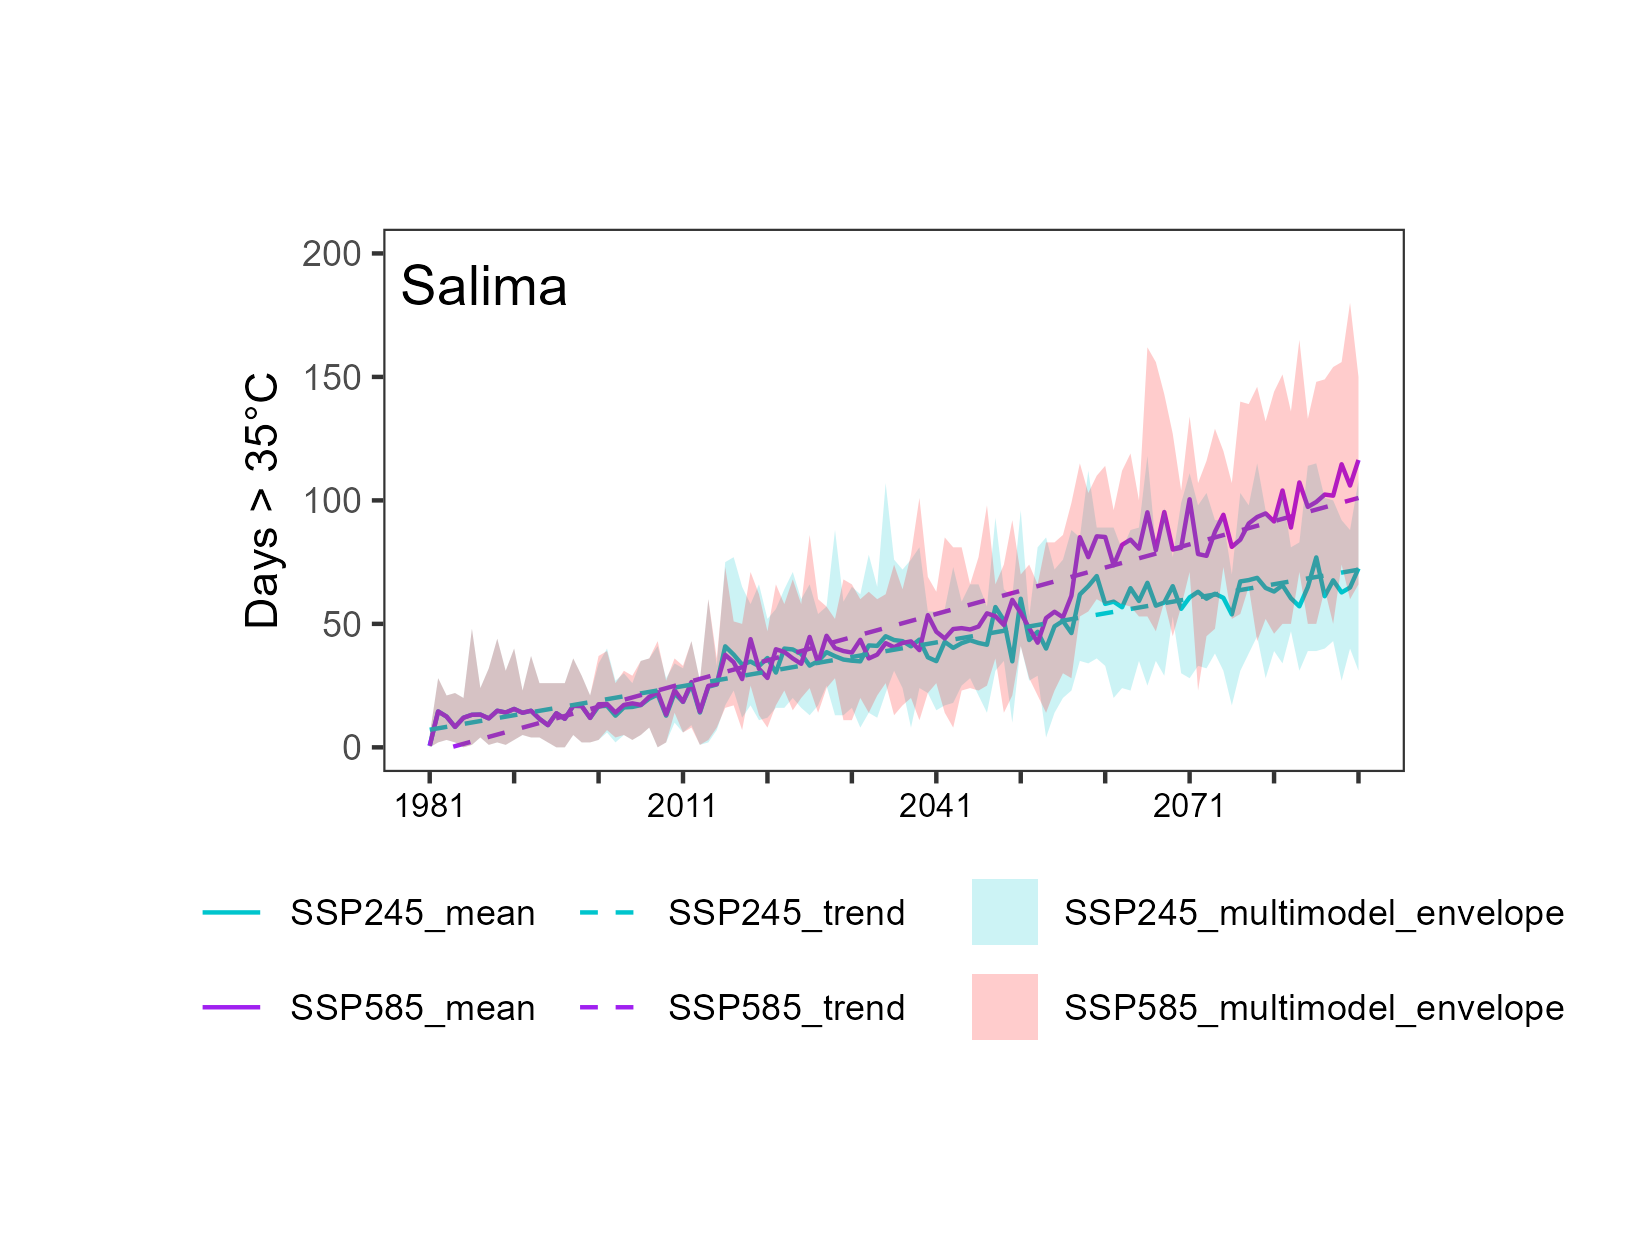
Heatwave days projections chart, Salima
Figure 2. Heatwave duration: Number of days where 35°C is exceeded for 3 consecutive days for both SSP2-4.5(green) and SSP5-8.5(purple). The dashed lines are the linear trends of the ensemble means for SSP members.